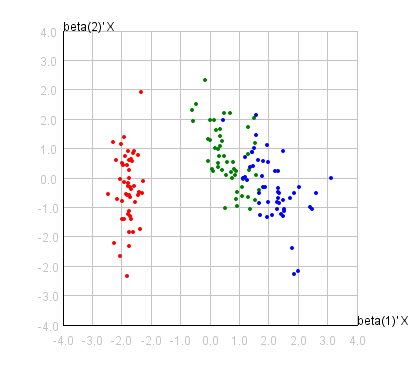
Figure 1: The projections for the wine data onto the estimated first
two-dimensional subspace. The symbols represent the three classes. Gaussian
kernel with scale of 0.05 is used.
Figure 2: The 3D animation for the iris data for three variables.
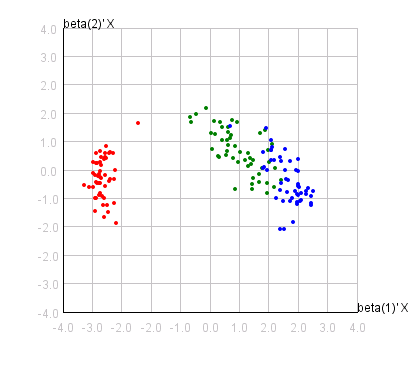
(a) SIR
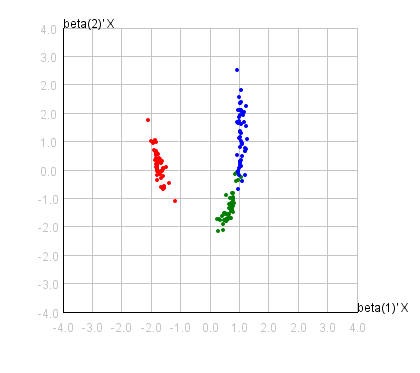
(b) KSIR with Gaussian kernel
of scale 0.05.
Figure 3: The 3D animation for the iris data for the first three dimension
reduction projections.
Wu, H. M.* (2008). Kernel Sliced Inverse
Regression with Applications to Classification, Journal of
Computational and Graphical Statistics. 17(3), 590-610.
http://www.hmwu.idv.tw/KSIR
Last updated:
2009/04/27